Using an R Container for Analytical Models
So it turns out I’m pretty bad at vacation. I had this idea for a blog post and one thing lead to another and here we are…
You probably know by now I hate installing things on my host. At my previous job we did a lot of work with using Python and R for data science. I still love plotting data with ggplot and my favorite R package, wes anderson color palette.
Here’s a fast intro into how to do this with an R Docker image.
Now everyone loves their share of different packages, without a doubt I bet most of them are written by Hadley Wickham ;). Can you imagine if the percentage of packages contributed by Hadley to CRAN was mirrored by someone to NPM or pip? It would be crazy.
We are going to start with an R base and build our ideal (aka you can make yours different, chill…) R data science container, with the following Dockerfile:
# our R base image
FROM r-base

# install packages
# these are ones I like
RUN echo 'install.packages(c("ggplot2", "plyr", "reshape2", "RColorBrewer", "scales","grid", "wesanderson"), repos="http://cran.us.r-project.org", dependencies=TRUE)' > /tmp/packages.R \
    && Rscript /tmp/packages.R

# create an R user
ENV HOME /home/user
RUN useradd --create-home --home-dir $HOME user \
    && chown -R user:user $HOME

WORKDIR $HOME
USER user

# set the command
CMD ["R"]
Build the image:
$ docker build --rm --force-rm -t jess/r-custom .
Run and use the image:
# we need X11 for the graph to display, alternatively
# you can save to a file that is in a bind-mounted dir
# or you can docker cp the file to the host :)
$ docker run -it --name analytics \
    -v /tmp/.X11-unix:/tmp/.X11-unix \
    -e DISPLAY=unix$DISPLAY \
    jess/r-custom

# bind mount your data
$ docker run -v $(pwd)/data:/home/user/data \
    -it --name analytics \
    -v /tmp/.X11-unix:/tmp/.X11-unix \
    -e DISPLAY=unix$DISPLAY \
    jess/r-custom
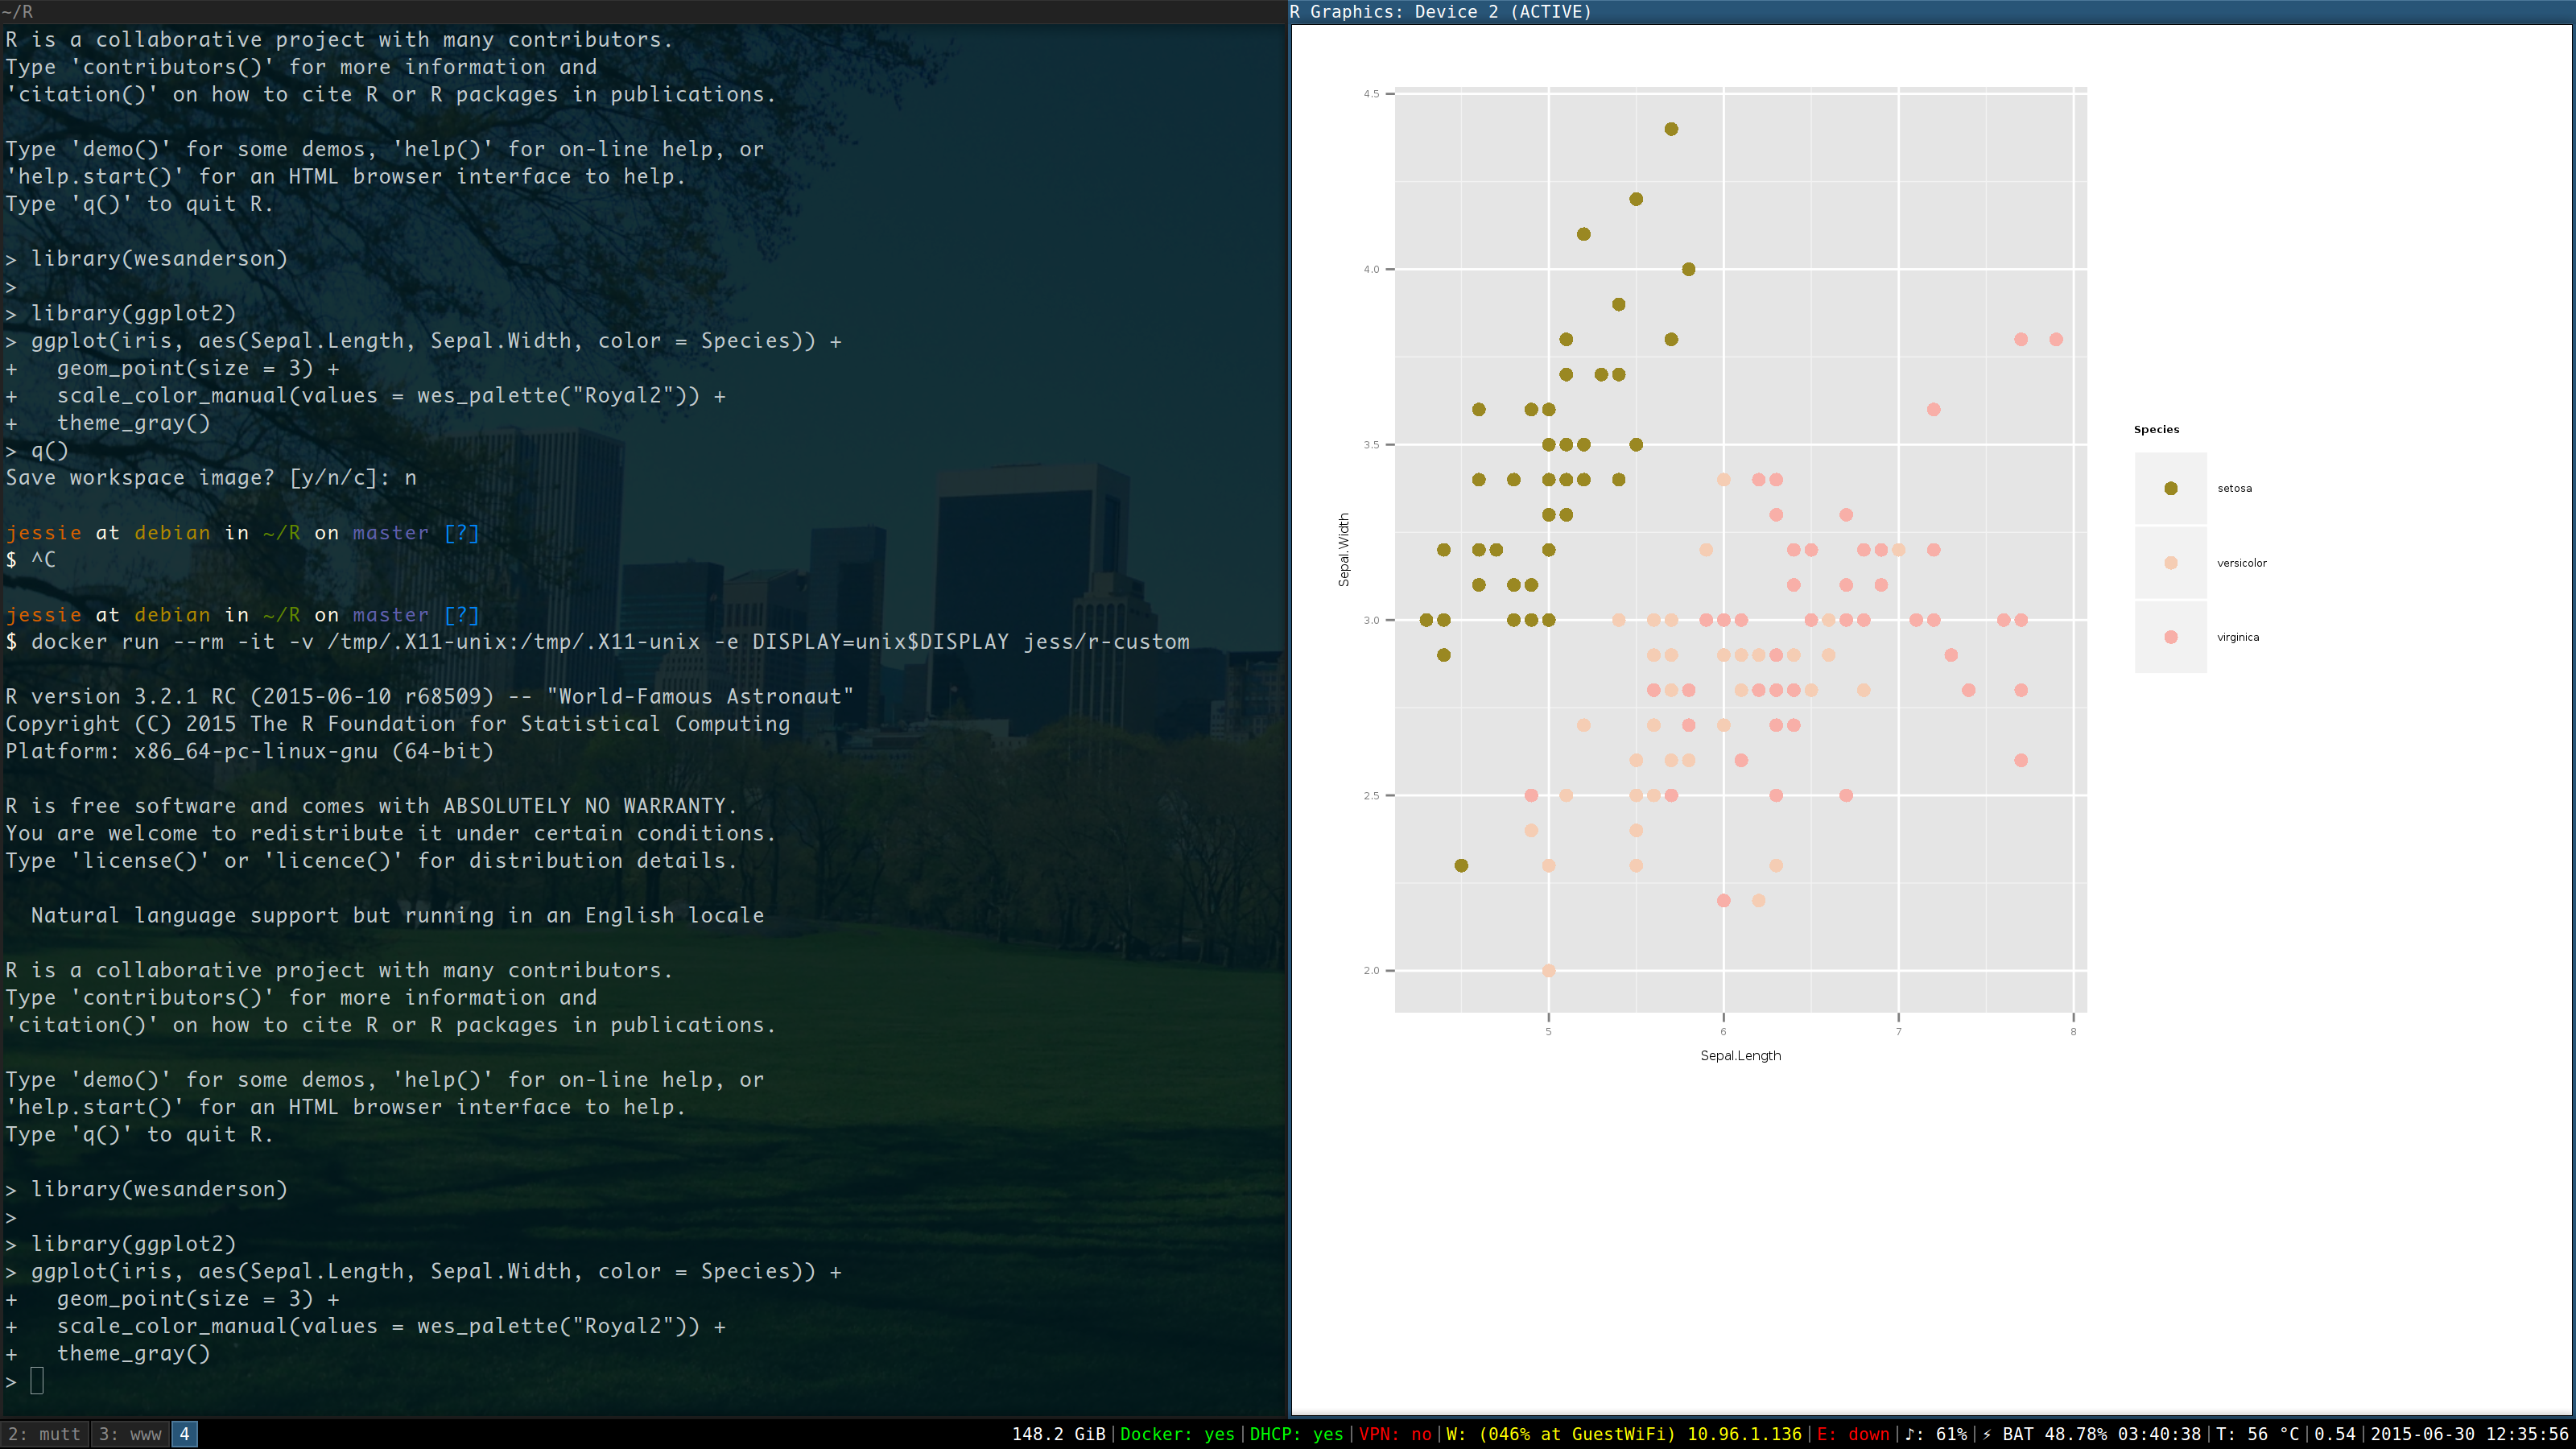
Now plot something:
library(wesanderson)

library(ggplot2)
ggplot(iris, aes(Sepal.Length, Sepal.Width, color = Species)) +
  geom_point(size = 3) +
  scale_color_manual(values = wes_palette("Royal2")) +
  theme_gray()
See that was super easy, now I can go back to being on vacation and reading the latest Vogue.
Other resources for such things:
- Rocker Wiki: for R in Docker examples
- yhat Blog: for all things fun and data sciencey, I might be biased though I used to work here